Dashboard of Data System – Expenditures and Revenues, Central Bureau of Statistics (CBS)
Company: Central Bureau of Statistics (CBS)
Product Name: Income and Expenditure Data Dashboard, 2019–2020
(Based on: Table A – Composition of Household Consumption Expenditures 2019–2022, Central Bureau of Statistics)
Field: Household Income and Expenditure Systems
My Role: Prototype Development, UX Design, UI Design
The Problem
Background – Household Expenditures
Before the COVID-19 outbreak in 2019, the average household consumption expenditure in Israel totaled NIS 15,900. The largest expenses were for housing (25%), transportation and communication (19.3%), and food (17.6%).
During the pandemic in 2020, household expenditures dropped significantly, the average household consumption expenditure fell to NIS 13,517, a real decrease of 14.9% compared to 2019. This decrease occurred across most consumption categories.
The sharpest declines were in transportation and communication (34.8%), clothing and footwear (32.2%), and education, culture, and entertainment (25.3%).
By the end of the pandemic in 2021, after the initial economic slowdown, expenditures began to rise again but had not yet returned to pre-pandemic levels. The average household consumption expenditure reached NIS 15,122, a real increase of 10.4% compared to 2020.
After COVID-19, in 2022, the average household consumption expenditure continued to rise, reaching NIS 17,600, a real increase of 12% compared to 2021. This increase resulted from several factors, including the recovery of the economy (leading to higher household incomes), the lifting of travel restrictions, and the return to in-office work, which led to higher spending on transportation, leisure, and dining out.
Household Income
During the pandemic in 2020, due to the prolonged lockdowns and economic crisis, there was a real decrease of 8.4% in employment income and 10.5% in capital income compared to 2019.
To mitigate the impact on households, the government provided financial support such as grants for all citizens, unemployment/compensation payments, and tax authority relief for the self-employed. Consequently, social benefits and allowances increased by 39% in real terms compared to 2019.
This government assistance helped limit the overall decrease in household income. In 2020, the average gross monthly income was NIS 19,287, compared to NIS 19,752 in 2019 (a real decrease of 1.8%). The average net monthly income was NIS 16,320, compared to NIS 16,559 in 2019 (a real decrease of 0.9%).
Toward the end of the crisis in 2021, there was a real increase of 2.9% in employment income compared to 2020. However, when compared to 2019 (pre-pandemic), the average monthly employment income was still 5.9% lower in real terms. Social benefits and allowances remained high in 2021, averaging NIS 3,137 compared to NIS 2,435 in 2019 (a real increase of 27.9%) because government support continued through the first half of 2021.
The gross household income rose 1.8% in real terms (from NIS 19,287 in 2020 to NIS 19,916 in 2021), and the net income rose 0.5% (from NIS 16,320 in 2020 to NIS 16,649 in 2021).
After the pandemic, in 2022, there was a real increase of 11.2% in average monthly employment income. This resulted from the recovery of the Israeli economy — renewed growth led to increases in employment rates, wages, and working conditions. The end of unemployment benefit payments in late 2021 and the increased demand for workers contributed to a rise in the average number of earners per household, from 1.28 in 2021 to 1.41 in 2022.
In 2022, the gross monthly household income increased 6.1% in real terms (from NIS 19,916 in 2021 to NIS 22,013 in 2022), and the net income rose 6.1% (from NIS 19,916 in 2021 to NIS 20,013 in 2022).
Project Goal
To present household income and expenditure data divided into categories and displayed in a management dashboard, enabling decision-makers to make data-driven decisions based on the presented insights.
System Objectives
Present data to CBS management.
Improve the workflow and experience of team members.
Create a smart, accessible, and unified management system for all CBS teams.
Target Audience
The system is designed for all CBS staff, primarily statisticians, including:
Data Analysts / Data Scientists
Socio-Economic Researchers
Economic Analysts
Economists
Socio-Economic Policy Officers
Business Model
The Central Bureau of Statistics (CBS) provides statistical data to the public and government to support decision-making, policy planning, and service improvement.
Existing Modules:
Academic institutions
Business companies
Private sector entities
Research Division of the Bank of Israel
Development Phases
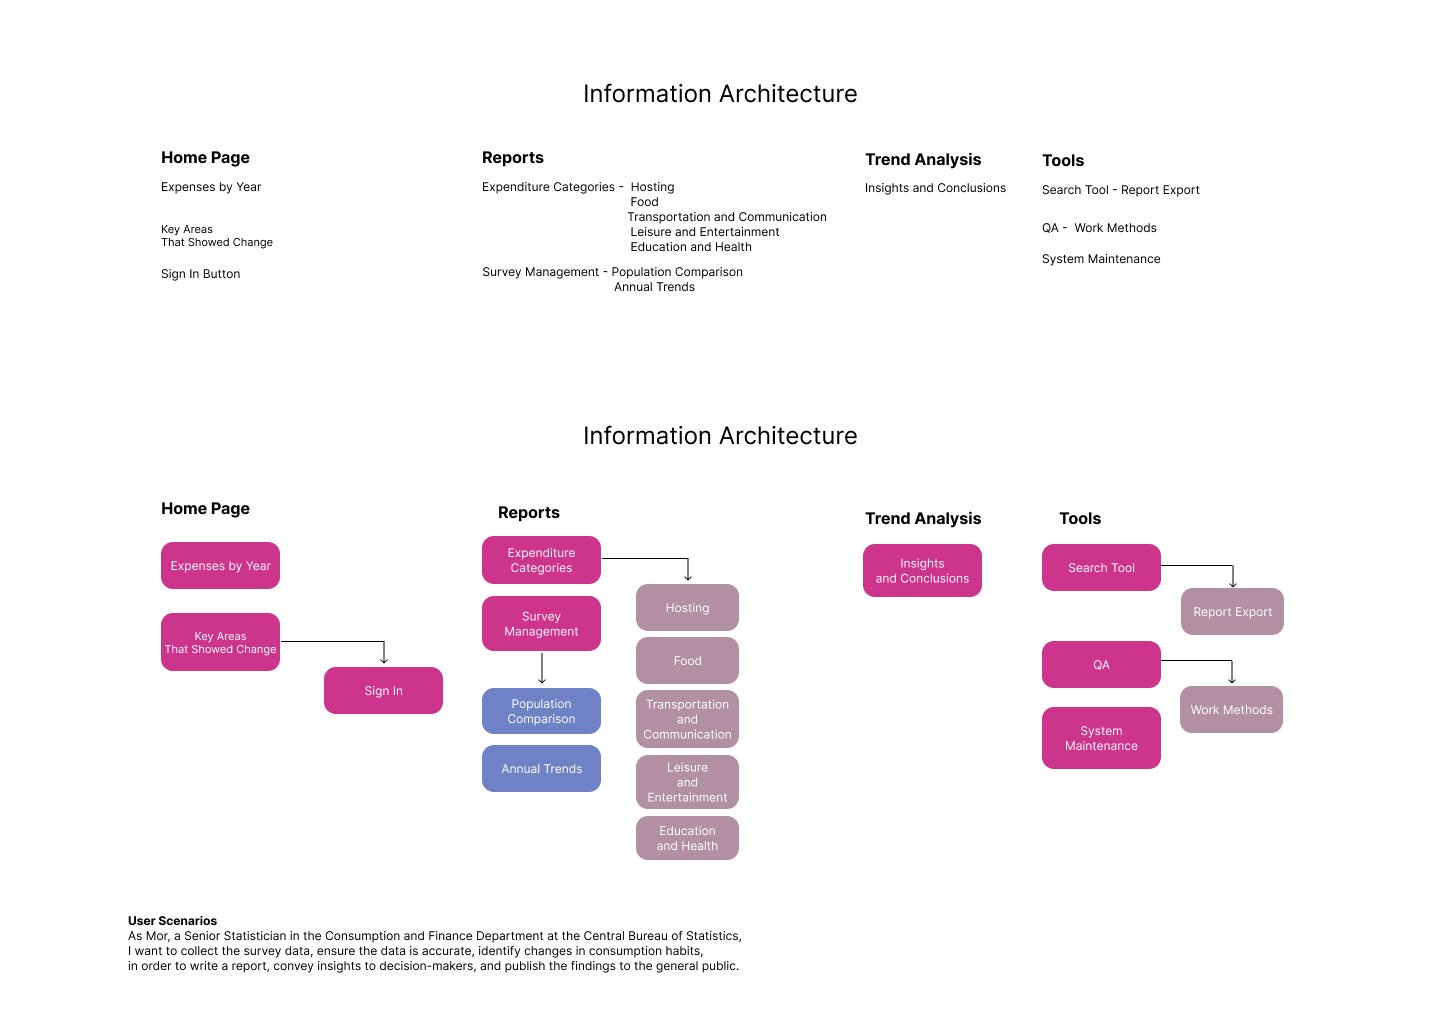
Phase 1: Initial dashboard presenting data on household expenditures by year and key categories, plus additional pages designed according to the system’s information architecture.
Phase 2: Development of a public-facing application.
The Solution
To identify challenges faced by CBS staff, I conducted user research including questionnaires and interviews with team members and management:
5 Data Analysts
2 Social Researchers
2 Economic Analysts
1 Economist
1 Socio-Economic Policy Officer
3 Stakeholders
User Research
I prepared a set of focused questions exploring user workflows and pain points, which I used in both interviews and questionnaires.
6 Interviews
14 Respondents
8 Questions
To uncover the root causes of problems and gain a deep understanding of user behaviors and needs, I conducted in-depth interviews with stakeholders and distributed surveys to department staff.
The key insights focused on identifying unmet needs and pain points in the existing system. this process helped reveal what was missing and what required improvement in the overall workflow.
Would you like me to adapt this into a professional case study format (with titles, visuals, and UX design language for a portfolio)? I can make it look like a polished project summary for Behance or your UX portfolio.
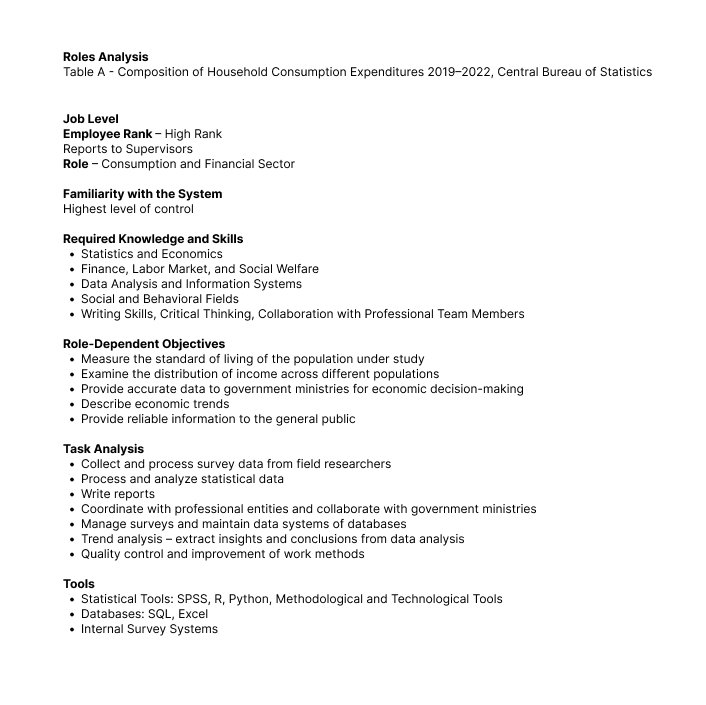
Role Analysis

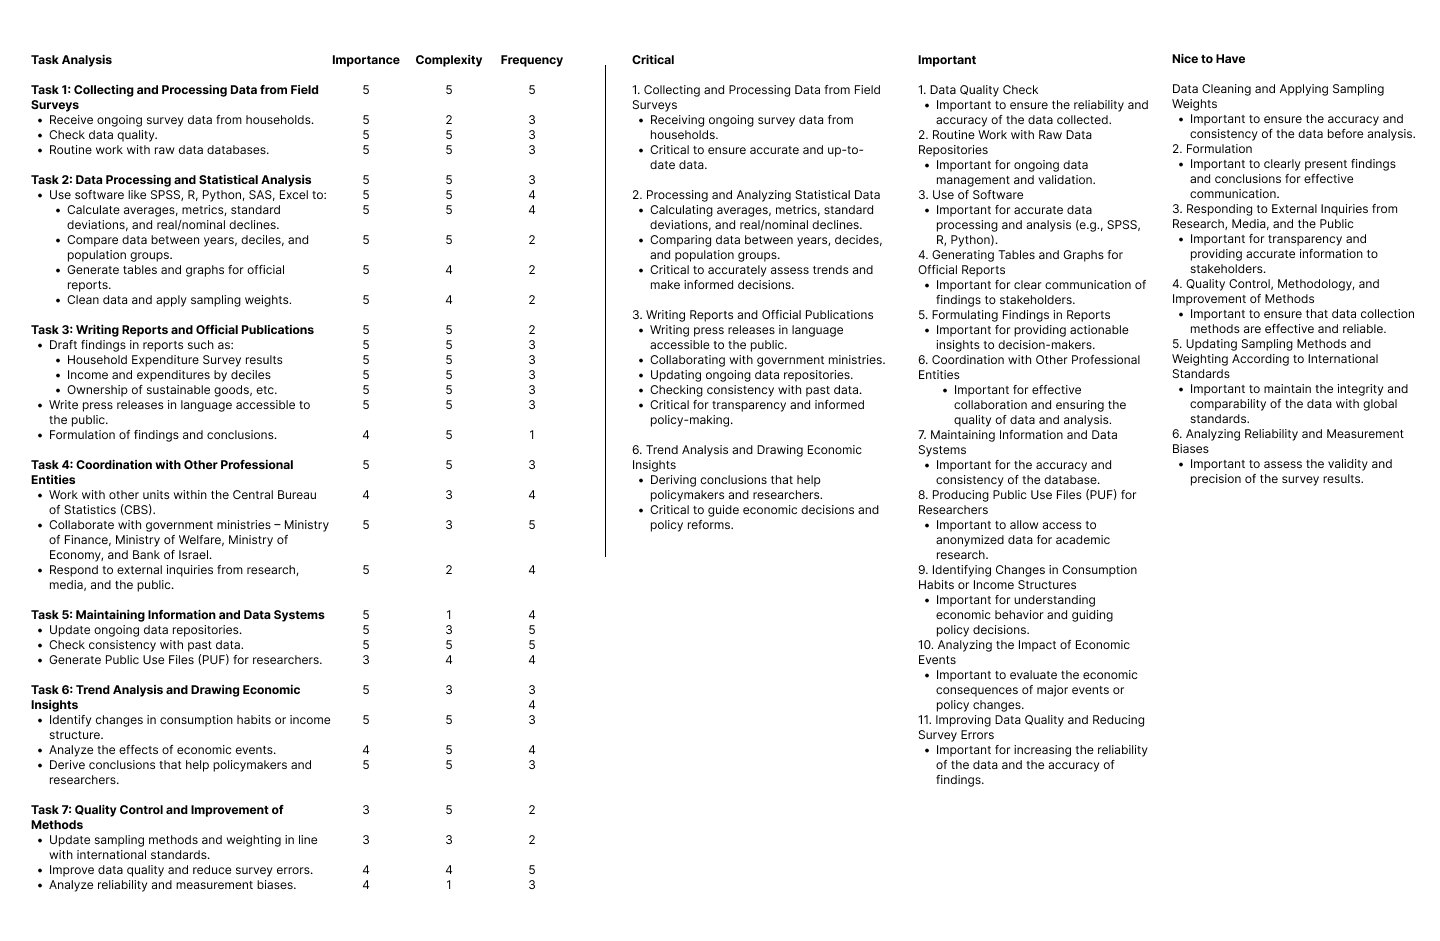
Task Analysis and Priority Ranking

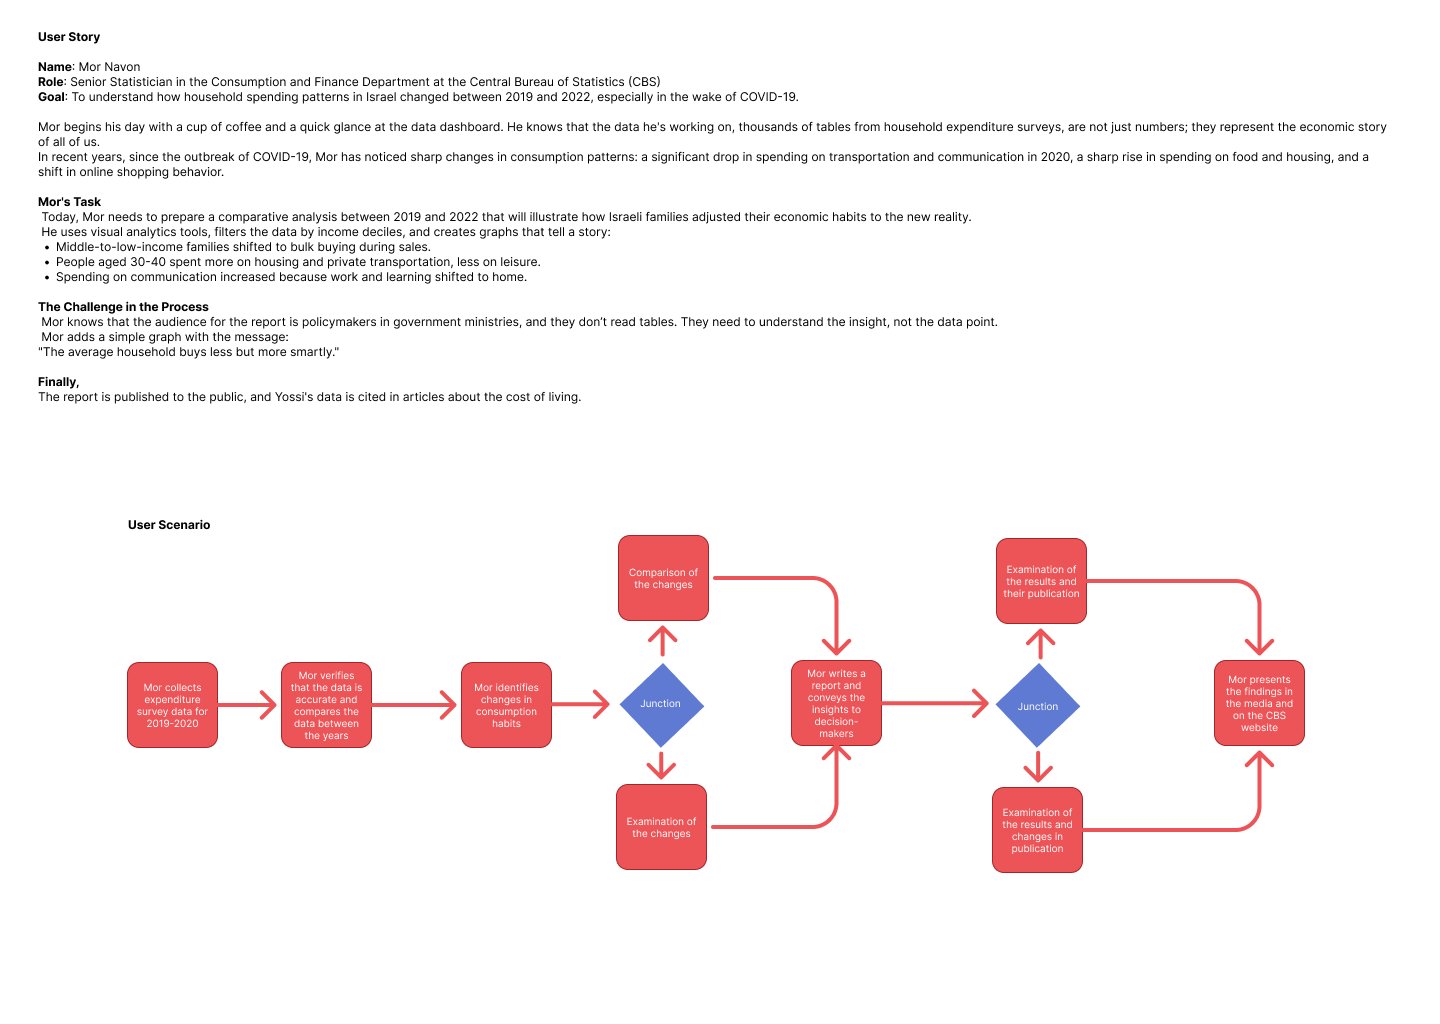
User Story & User Scenario

Information Architecture

